New York Subway Traffic Analysis
NYC Subway Ridership Analysis
By: Saleem Khan
Photo by mentatdgt from Pexels
Note: This was a hypothetical client project for the Metis Data Science Bootcamp
Problem Statement
WomenTechWomenYes (WTWY) is a non-profit organization whose mission is to promote the participation of women in the technology sector. This group holds an annual fundraising gala in order to raise awareness and receive donations to promote their cause. The group uses a street team for outreach and promotion of their gala event.
WomenTechWomenYes (WTWY) has an annual gala at the beginning of the summer each year. As we are new and inclusive organization, we try to do double duty with the gala both to fill our event space with individuals passionate about increasing the participation of women in technology, and to concurrently build awareness and reach.
To promote their event WTWY enlists a street team that is placed at entrances to New York City subway stations. The street team is responsible for collecting e-mail addresses and those who sign up receive free tickets to the gala event.
The organization asked for help in using MTA subway data to help optimize the placement of their street teams. The goal is to optimize not only the number of attendees but those that will most likely to contribute to their cause.
Data Selection

*Photo by Kevin Ku from Pexels
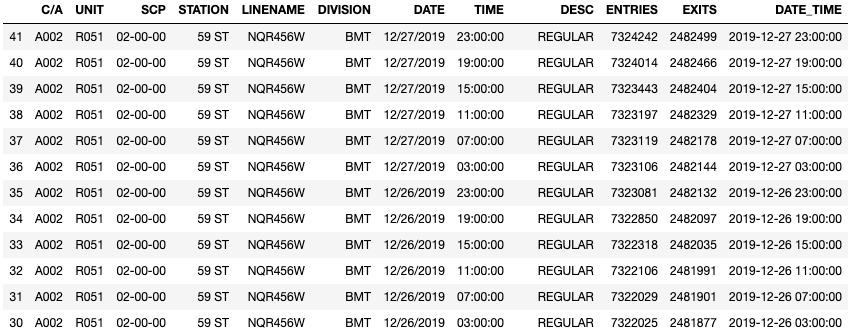
The first step in this data analysis was to identify an appropriate dataset. The New York City MTA (Metropolitan Transit Authority) has made ten years’ worth of turnstile data available on their mta.info website. This data provides details on over 400 stations across the MTA and PATH systems along with individual turnstiles, counter and booth information. The data is counter-based meaning the data collected from each turnstile increments up every time a new rider swipes. The counters seems to have an arbitrary reset after a certain counter limit is reached.
More information on the MTA dataset can be found here: MTA Turnstile Dataset
Exploratory Data Analysis
Once the data was identified, i had to do some basic analysis to get a better sense of what the data represents. I pulled down data for all of 2019 for this analysis. Each row within this dataset represented a unique station, unit, turnstile, date and time combination along with an entry and exit counter reading. There were over 10M entries in this dataset.
The first thing i had to do to get a sense of where the street team should be deployed is to look at the yearly aggregate counts for all unique subway station entries. The graph below represents the yearly entry totals for the top 20 subway stations.
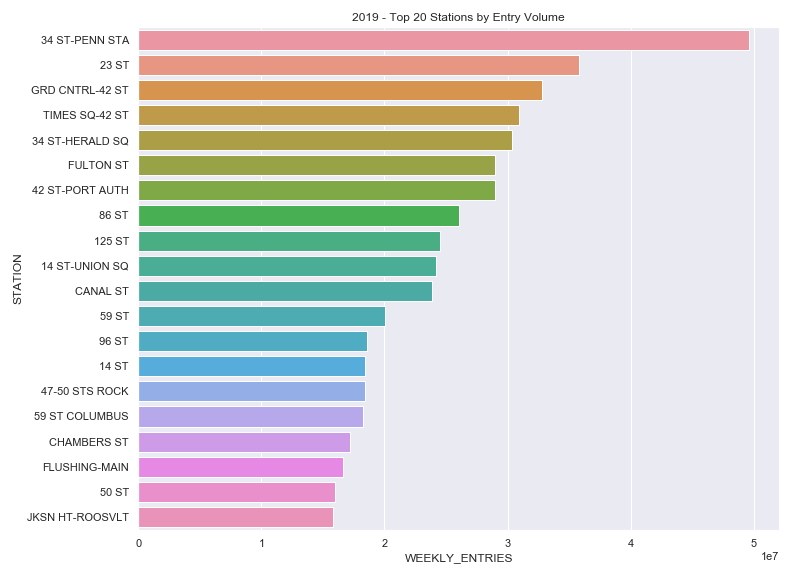
x-axis is in 10’s of millions
Recomendation #1 The street team should be deployed to the top 20 stations by volume in NYC.
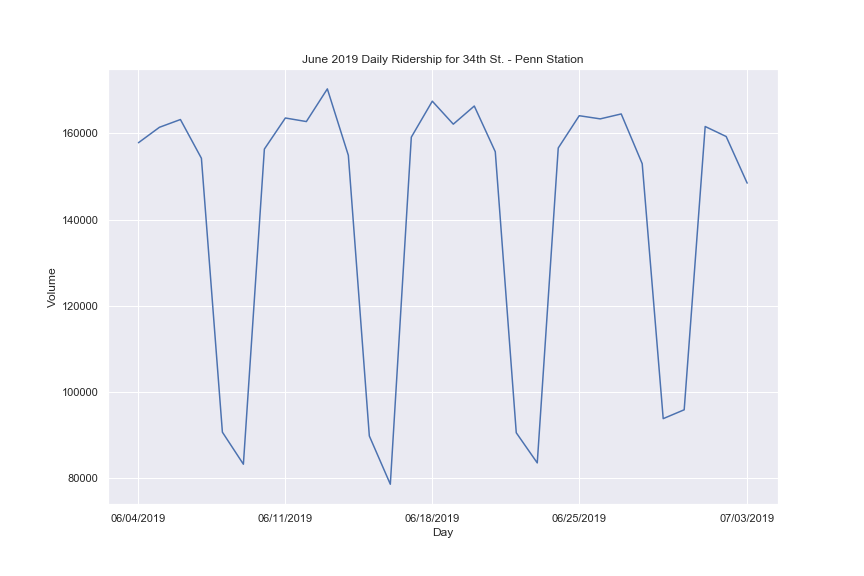
By far the busiest subway station in NYC is 34th St - Penn. Station. This subway station receives almost 30% more traffic than the second busiest subway station. I wanted to look at whether there were any seasonality effects for this subways station. The plot below shows a daily view of ridership for all of 2019. You will notice that subway ridership peaks during the spring and fall months but the changes over the rest of the year is negligible.
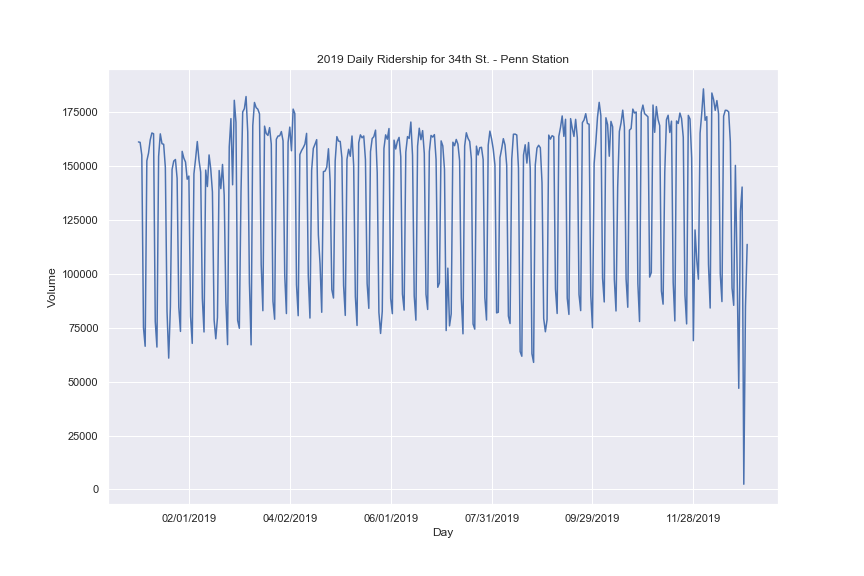
Recomendation #2 The street team can be deployed any time of year as seasonality is not a major factor. Most of the street team should be deployed to the 34th Street station since it handles 30% more volume than the second busiest station.
I then needed to look at the best days of the week to deploy the street team. I had a hunch that subway ridership would decrease on the weekend and increase during the work week. The image below proves this intuition. We see an ebb and flow to the ridership where peak traffic occurs between Tuesday and Thursday and wanes on Saturday and Sunday.
Recomendation #3 Deploy street team resources during the work week specifically from Tuesday through Thursday.
The last question is whether there is a certain time of day that is ideal for reaching a bigger audience. After taking a closer look at the data we do see that there is a marked increase in traffic during specific times of the day. The peak hours seem to be between 6-10AM and 2-6PM. The image below shows this visually.
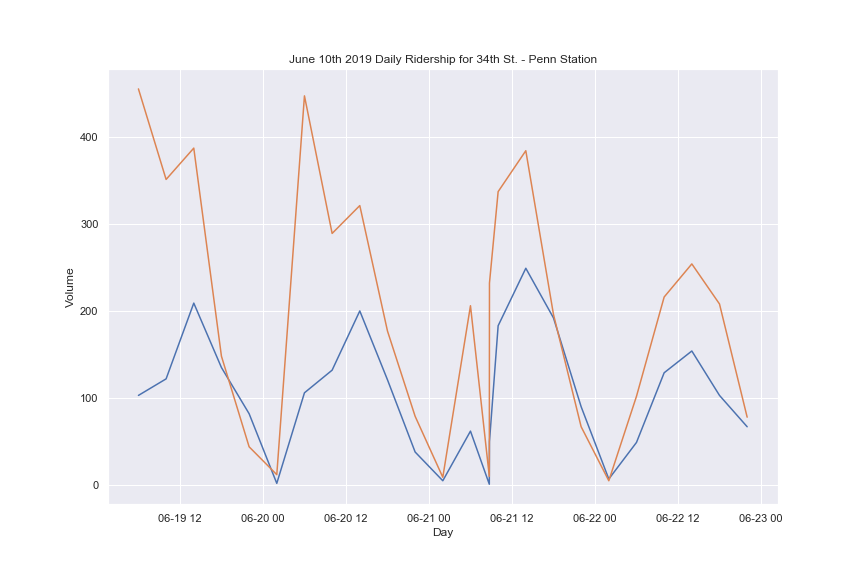
Recommendation #4 Deploy the street team during peak rush hour times of 6-10AM and 2-6PM.
Conclusion & Follow-Up
Analyzing the MTA data allowed me to arrive at some early conclusions about how best to deploy the WTWY street team resources. We have four specific recommendations that should put the organization on a good trajectory to maximize donations.
For future consideration I would need to look at the following to enhance this analysis:
- Social Media / GPS Data - Include data from social media data providers which provide uniqie mobile devices travelling through a specific subway station. This will allow us to better target the female demographic that this group is interested in.
- Tech Hubs - Find locations within NYC where there are tech hubs that would attract more of the demographic that this group is interested in.
- Demographic/Income Data - Use US Census data to determine whether there are higher pockets of female demographics in the NYC area and also add in income data to improve likelihood of donations.